 |
SWMMVis
6.0.0-alpha.4
Qt6/C++ GIS-based graphical user interface for the SWMMVis engine (6.0.0-alpha.4)
|
|
SWMMVis
6.0.0-alpha.4
Qt6/C++ GIS-based graphical user interface for the SWMMVis engine (6.0.0-alpha.4)
|
Run a small sewer/surface model, inspect exchange in both directions, and compare its output with published measurements while keeping numerical checks and experimental agreement distinct. The 0.24 m manhole and flume dimensions follow Rubinato et al. (2017). The boundary conditions are reconstructed or synthetic, as identified below.
Node coupling type and geometry, coefficient presets, mesh mapping, surface-head sampling, storage area, simulation options, 1D and 2D results, head/depth plots, continuity reporting, and model save/reload.
Open Rubinato 2017: Sewer-Surface Exchange from the Welcome page and choose a working folder. The example opens model.inp, the synthetic T9 demonstration. Alternatively, download and extract rubinato2017_examples.zip, then open model.inp. Use steady_s1.inp through steady_s4.inp for the four flow regimes. Copy the inputs and reference CSV files into a working folder before running. The included README records every modelling assumption and the report's reference demonstration values.
The hydraulic reference comparison provides the illustrated report, all 36 steady comparisons and the exchange formulation. The ZIP also includes the reference tables and comparison CSV. Experimental qualification remains incomplete.
Open the interactive results viewer to inspect the measured/simulated comparisons by regime and play the synthetic T9 surface results with a shared hydrograph cursor. It works offline. A printable four-figure supplement and PNG/SVG figures with the plotted data are available for review and reuse.
model.inp. Inspect the 8 m by 4 m triangular mesh and the central MH storage node. IN and OUT are schematic pipe-boundary nodes; only MH exchanges with the surface. Preserve that authored mapping.MANHOLE, diameter 0.24 m and preset RUBINATO2017. Its storage curve and MIN_SURFAREA are both 0.0452389 m2. Storage nodes use their own curve; selecting a junction pond mode does not replace it. The map row omits Cd/Area overrides so the structure coefficients govern.WEIR_ORIFICE, surface head STENCIL_WET_MEAN, and coupling equalisation. The model is in metres and m3/s. Inspect the synthetic inflow timeseries: the rise starts at 00:01:00 and the plateau begins at 00:01:30. Times have three fields, hours:minutes:seconds. Two fields would move the pulse outside the ten-minute run..out and 2D .2d.h5 results. Plot MH head and surface depth/HGL from cells beside the manhole using a common time axis. Inspect the 0.478 m crest level, surcharge during the imposed pulse and subsequent drainback. The review's synthetic plot is model output only; it contains no measured exchange hydrograph.
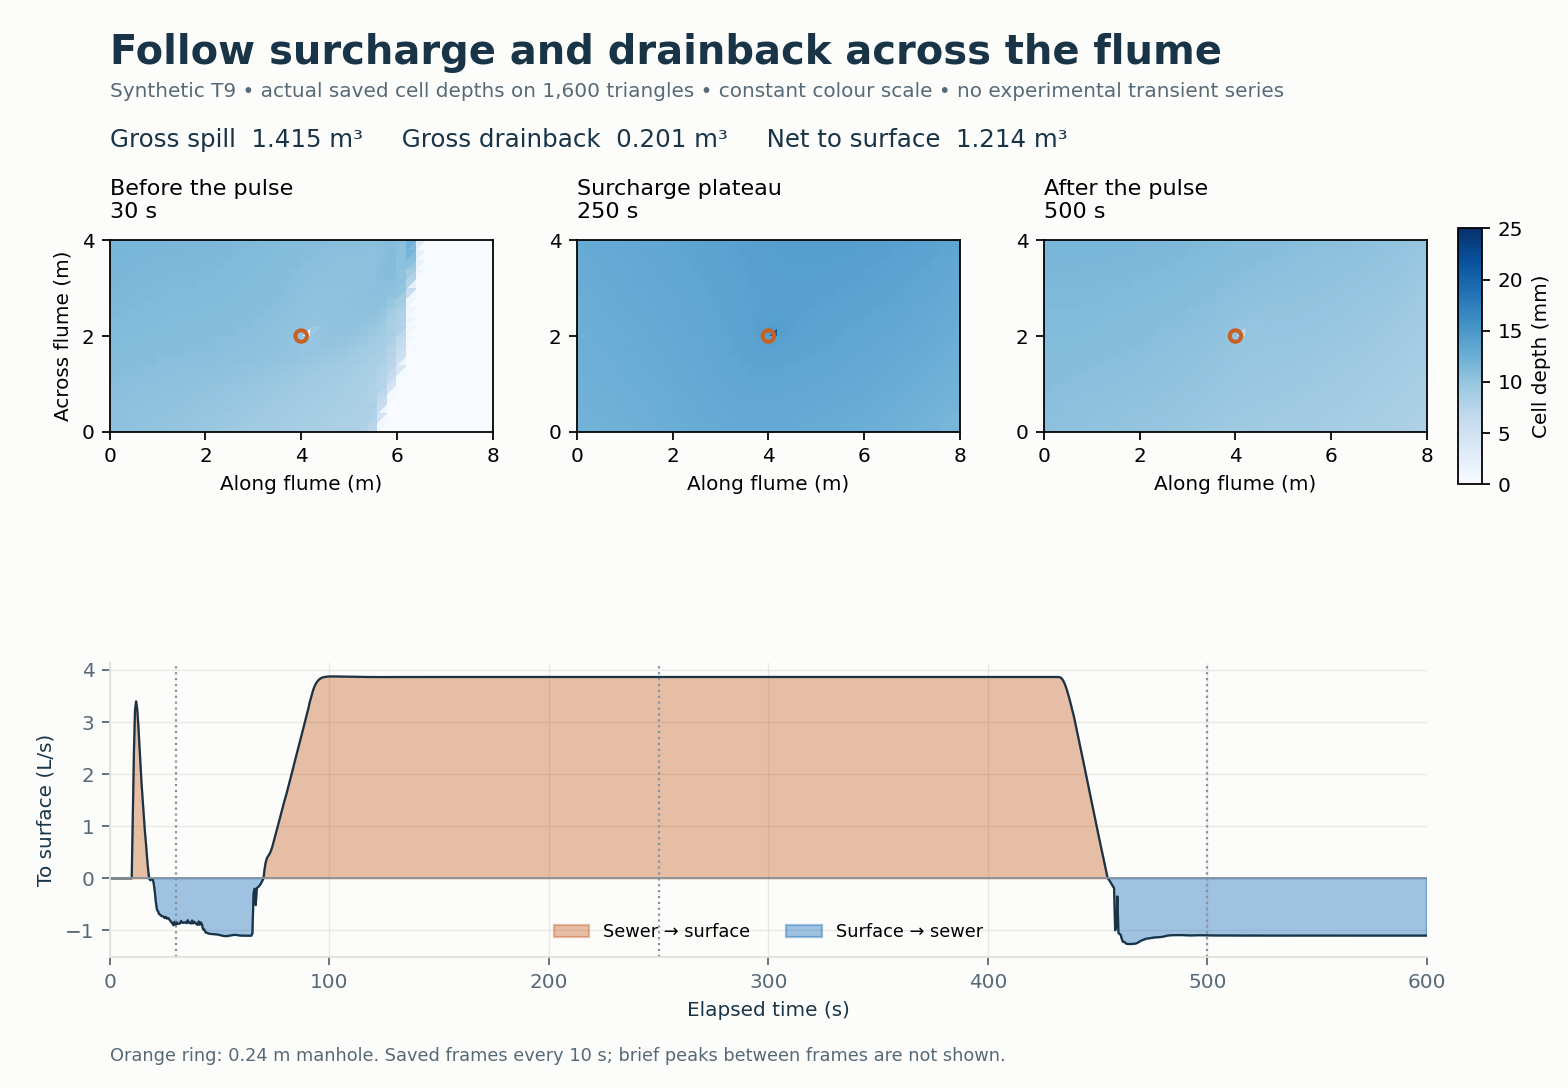
The maps use a fixed 0–25 mm colour scale; the orange ring marks the manhole. The vertical markers identify their times on the hydrograph. Surface inflow continues throughout the run, so the map includes both inflow and surcharge water. In the viewer, use Play, Restart, the speed selector and the frame slider to inspect the saved states. Gross spill and gross drainback update alongside the displayed time. The depth fields are saved every 10 s and are not interpolated; their maximum is 20.909 mm, while the all-step maximum is 24.803 mm. The native hydrograph retains the routing-step samples. These figures are calculated from saved results, rather than screenshots of the application.
Run each steady input. Use the automated benchmark CSV for late-window exchange: it exports the 240-300 s mean and compares it with 180-240 s. The end-of-run report totals divided by 300 s give a whole-run average, not the last-minute rate. Only compare a rate as steady when those windows agree acceptably and both domain ledgers are acceptable. The full review includes all rows; the four supplied steady inputs are only the first row of each scenario.
| Scenario | Measurement in the supplied seed (L/s) | Meaning |
|---|---|---|
| S1 | 0.69 | Free-weir drainage, no sewer inflow |
| S2 | 0.24 | Submerged-weir drainage near the crest |
| S3 | 1.73 | Surcharge onto a wet floodplain |
| S4 | 1.74 | Surcharge with no incoming surface flow |
Do not treat a successful run or recovered regression slope as an experimental pass. Only 8 of 36 physical-shaft rates at the review's 0.5 s step lie in the illustrative measurement-variation-plus-2% comparison band, and some rates are not temporally converged. The paper's Table 3 slopes belong to fits with nonzero intercepts. Its wet outward orifice value is not an independently calibrated inward-orifice coefficient.
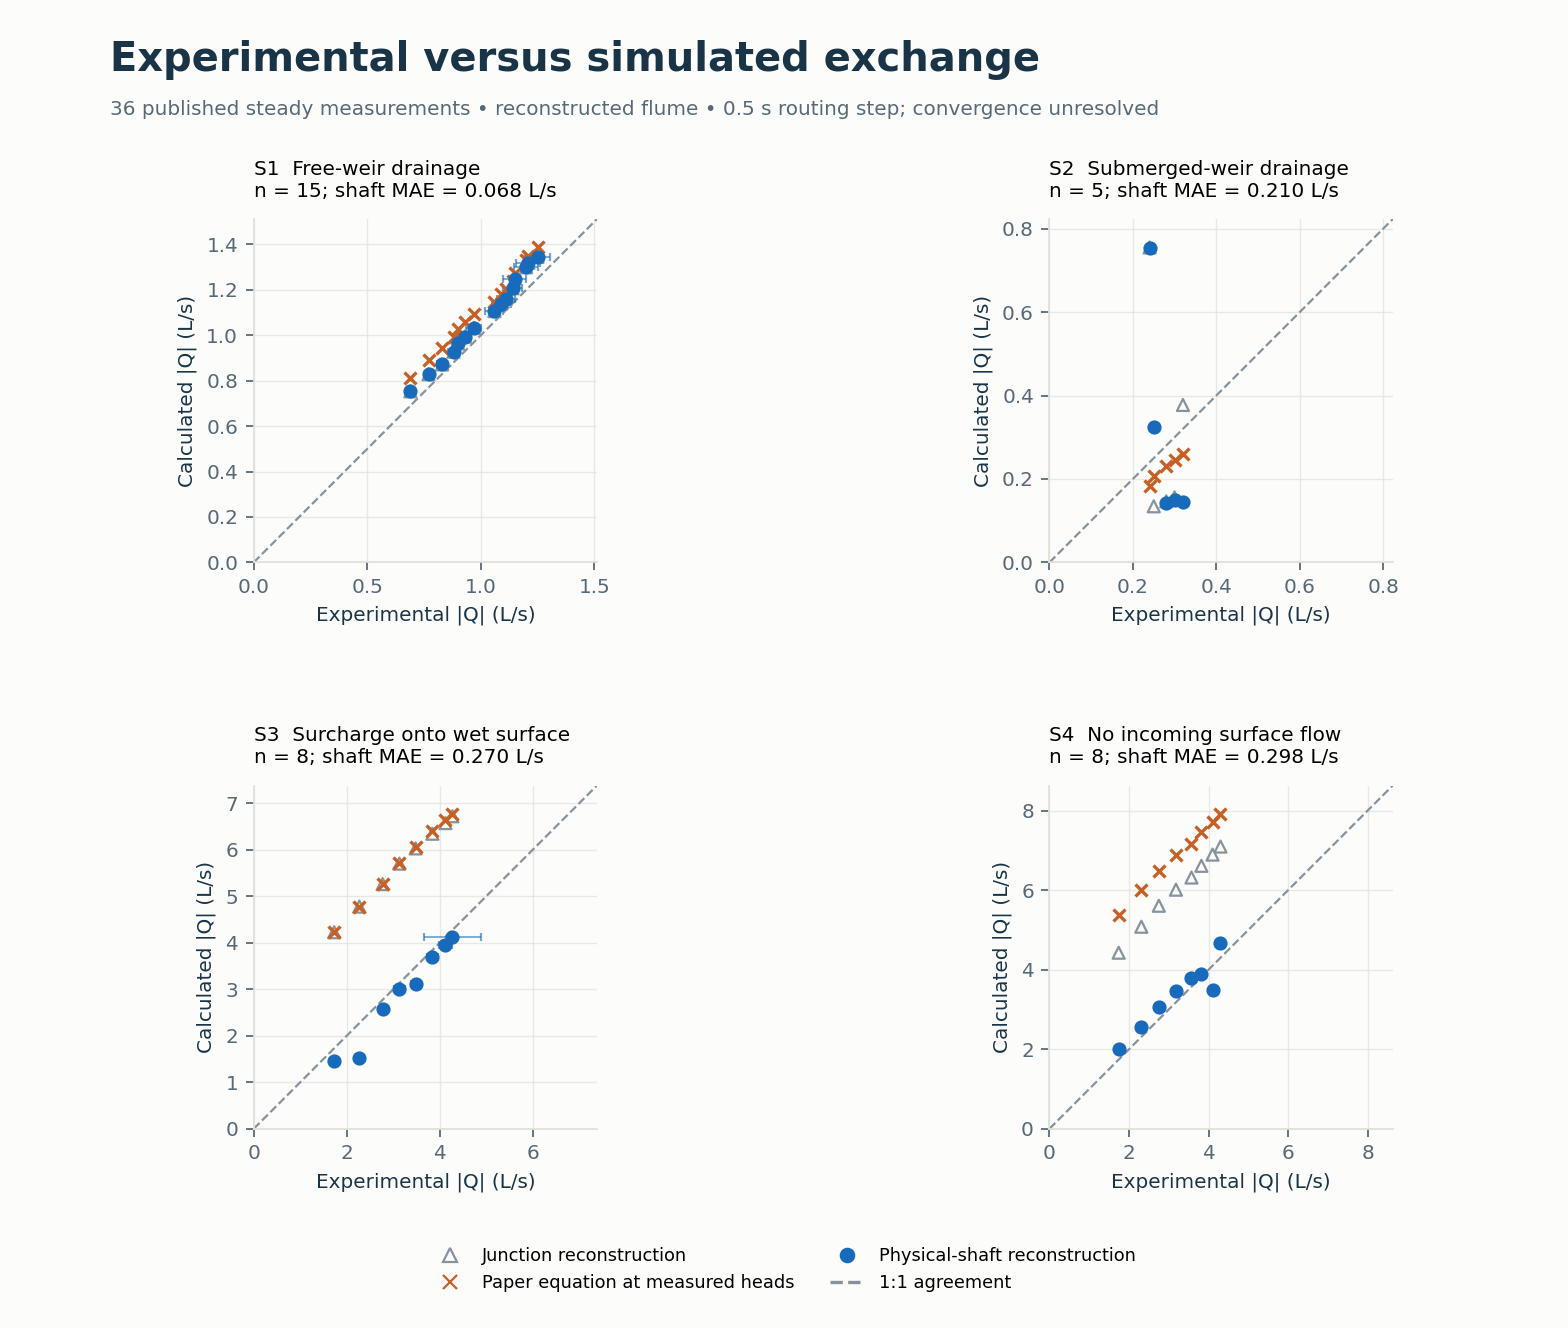
Blue points show the physical-shaft model, open triangles the original junction model, and orange crosses the bare paper equations evaluated at measured heads. The dashed line is 1:1 agreement. Horizontal error bars show the paper's measurement variation \(\xi_f\). Both axes within each panel use the same scale; the scale changes between regimes. MAE describes the physical-shaft absolute residual in L/s. All full-engine points here use the review's 0.5 s step and remain subject to convergence checks.
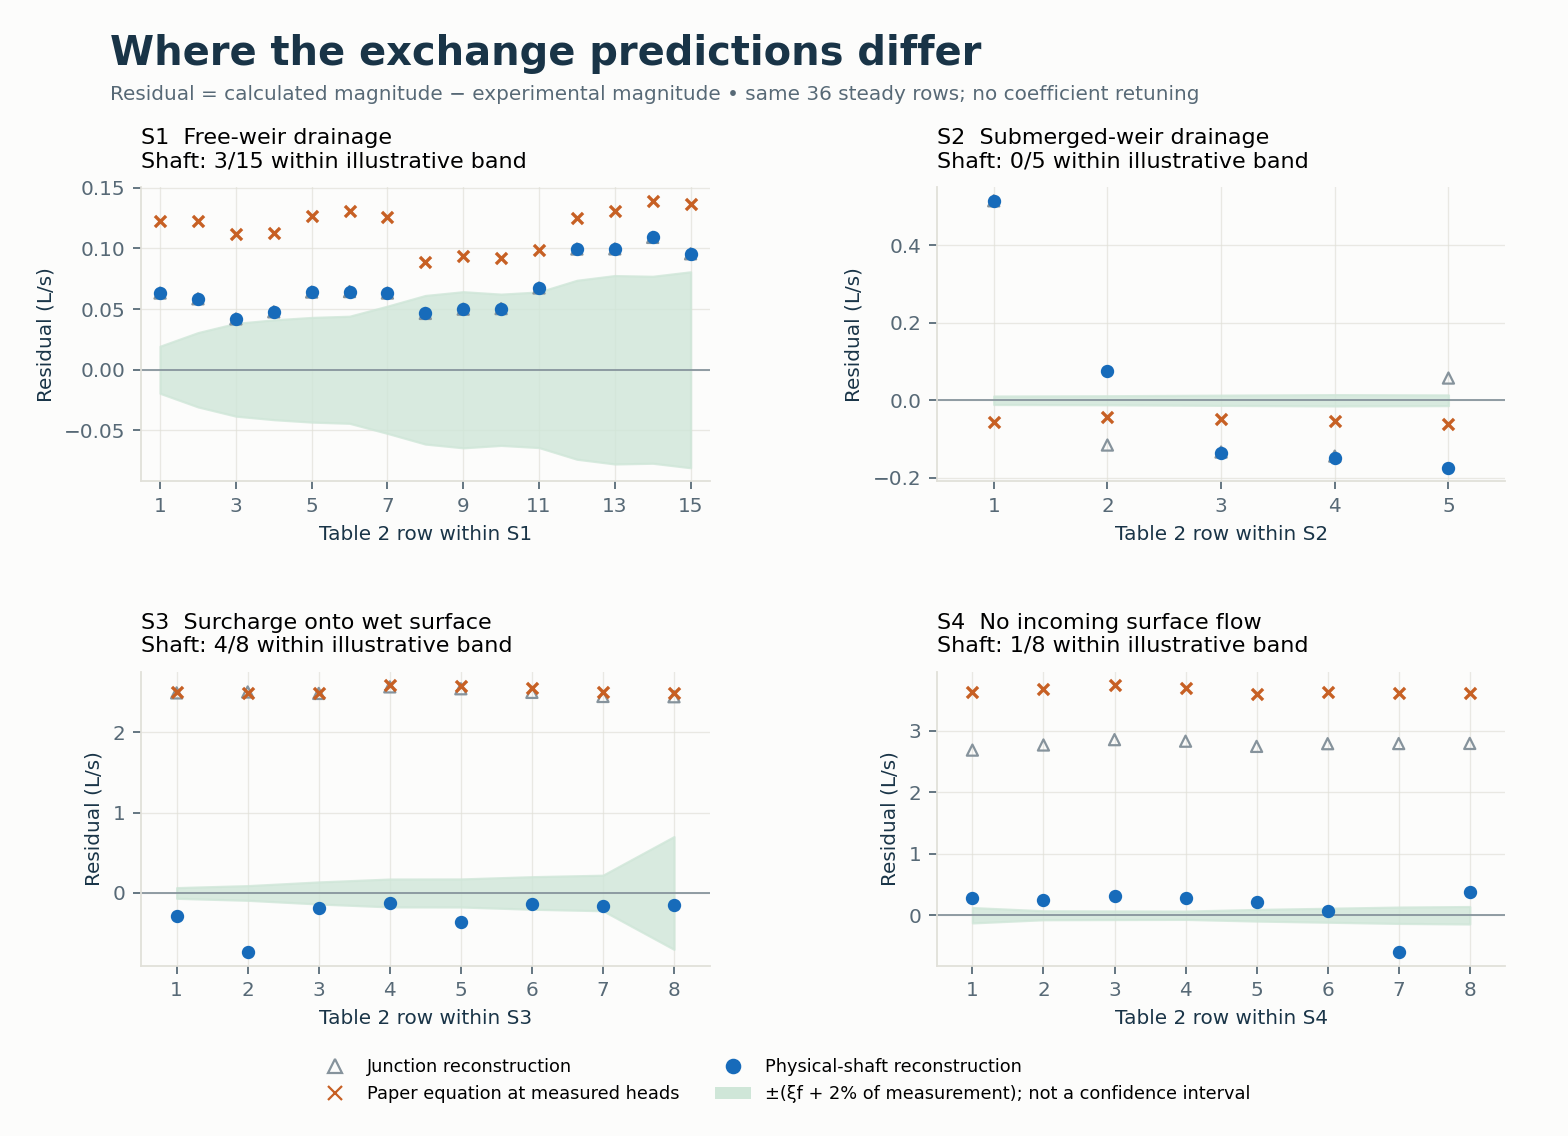
Residuals are calculated minus measured discharge magnitudes. The green band is \(\pm(\xi_f+0.02Q_e)\), an illustrative comparison criterion. Row numbers restart within each regime. The points and band retain the disagreements that a successful run alone cannot reveal.
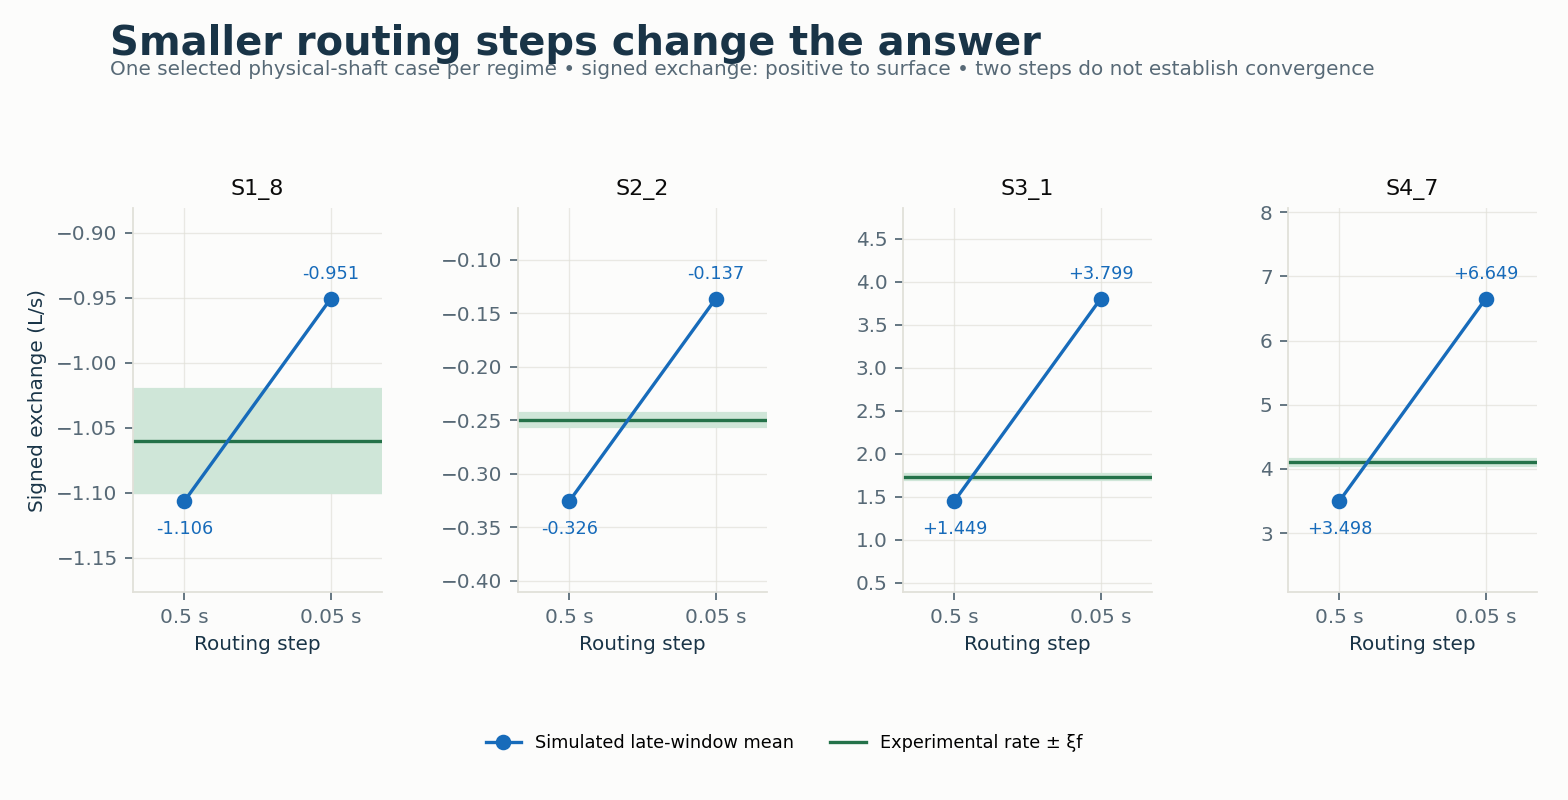
Green lines/bands show the signed experimental rate and \(\xi_f\). The blue points show how reducing the routing step changes the late-window mean in one selected case per regime. Positive is sewer to surface. These four reruns do not establish convergence of the full matrix.
The figures above preserve the 21 October review. The follow-up changes the numerical smoothing schedule, with physical coefficients and geometry held fixed. In a copy of a steady input, open Simulation Options → 2D Surface Routing → Hydraulics. Under Explicit marcher set Momentum θ to 0.8 and Smoothing reference interval to 1 s. The engine key is THETA_REFERENCE_STEP. Zero means the original per-step smoothing; older engines disable the new control.
Keep the 1 s reference fixed in three copies with routing steps 0.0125, 0.00625 and 0.003125 s. To match the study, use maximum 1D trials 80, head tolerance 0.00001 m, variable step 0 and lengthening step 0. These are numerical controls; the reference interval was not fitted to measurements. Compare mean exchange over 240–300 s, the preceding minute, heads and separate 1D/2D continuity. The supplied steady examples are the first row of each regime; the download includes every Table 2 row and identifies each case.
All 36 cases meet the 1% final timestep-change criterion (maximum 0.516%) and the separate 2% drift/ordinary 1D continuity checks. 0/36 meet the illustrative experimental comparison band. This improves numerical consistency; experimental qualification remains incomplete.
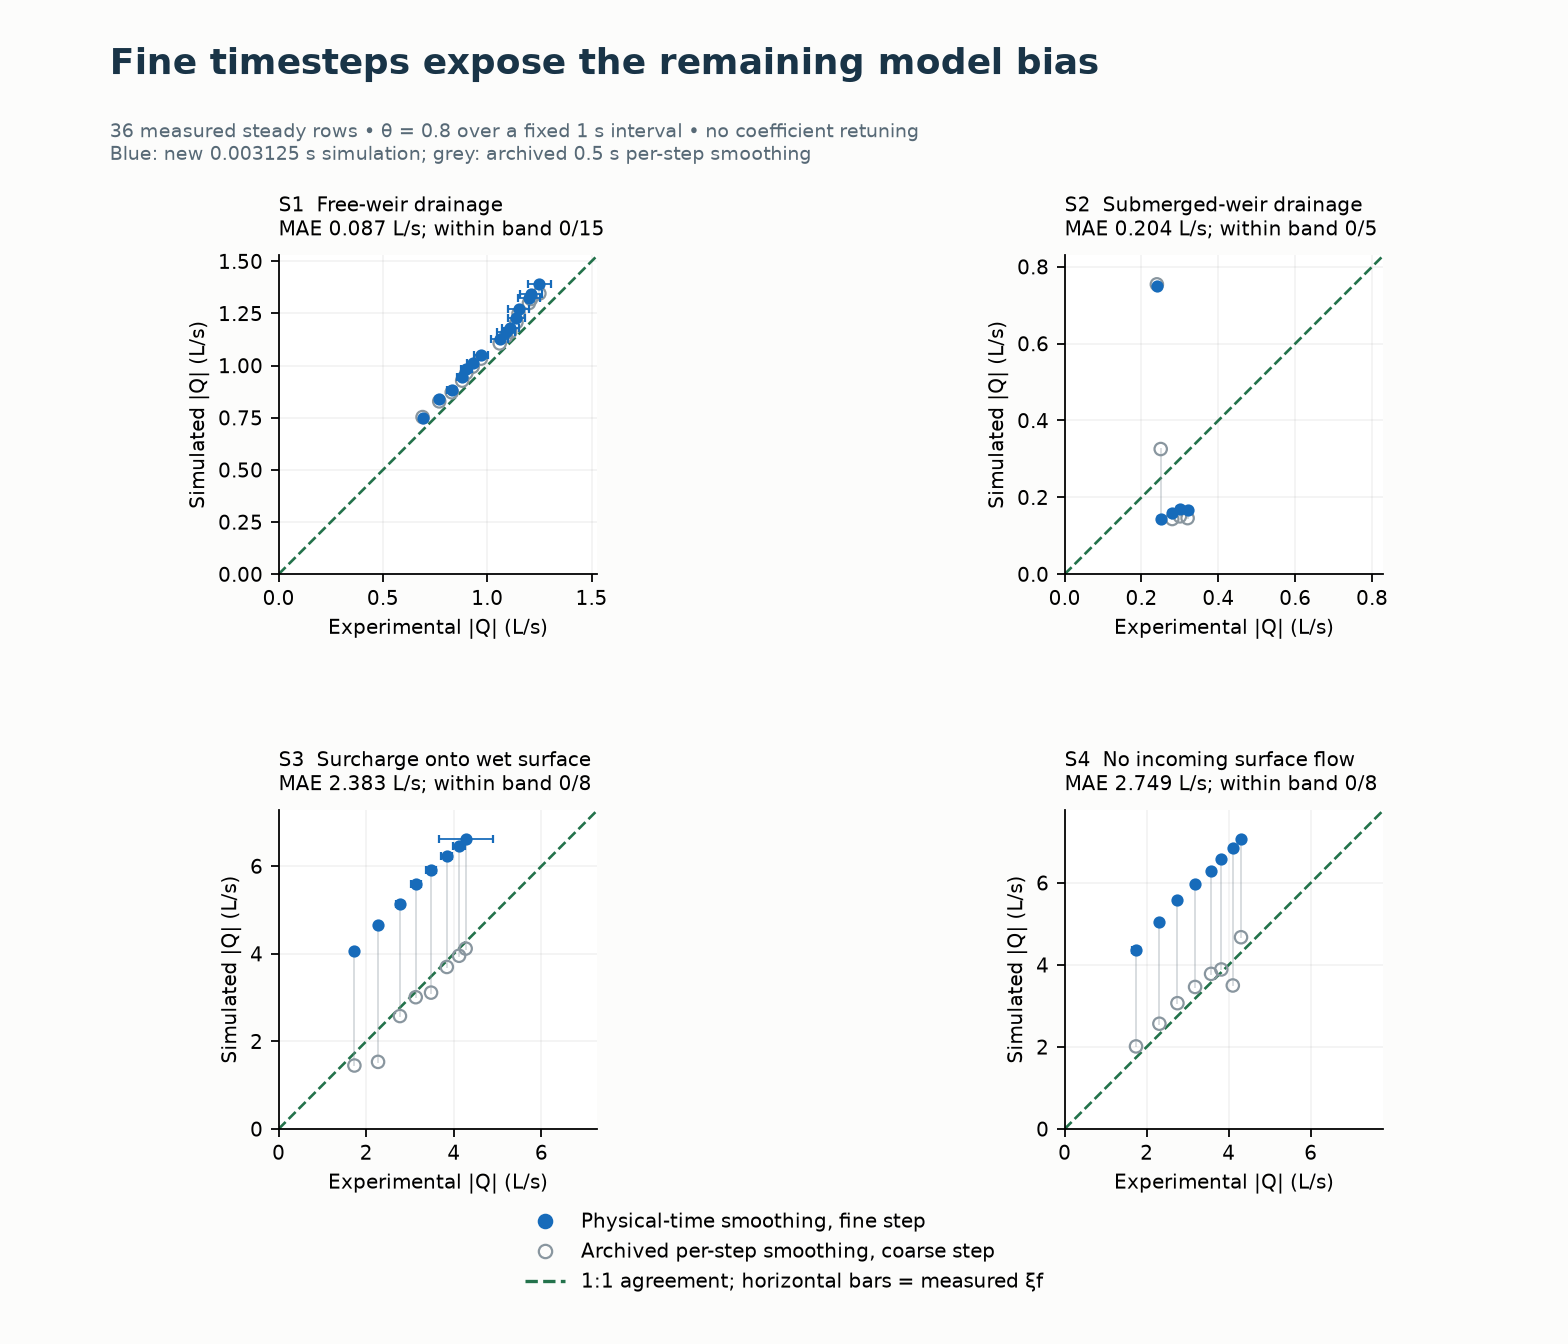
Blue filled circles are the new simulated rates at 0.003125 s. Gray open circles are the older 0.5 s per-step results. The green dashed line shows 1:1 agreement and horizontal bars the measured variation. The new points expose the remaining model bias; they do not establish experimental validation.
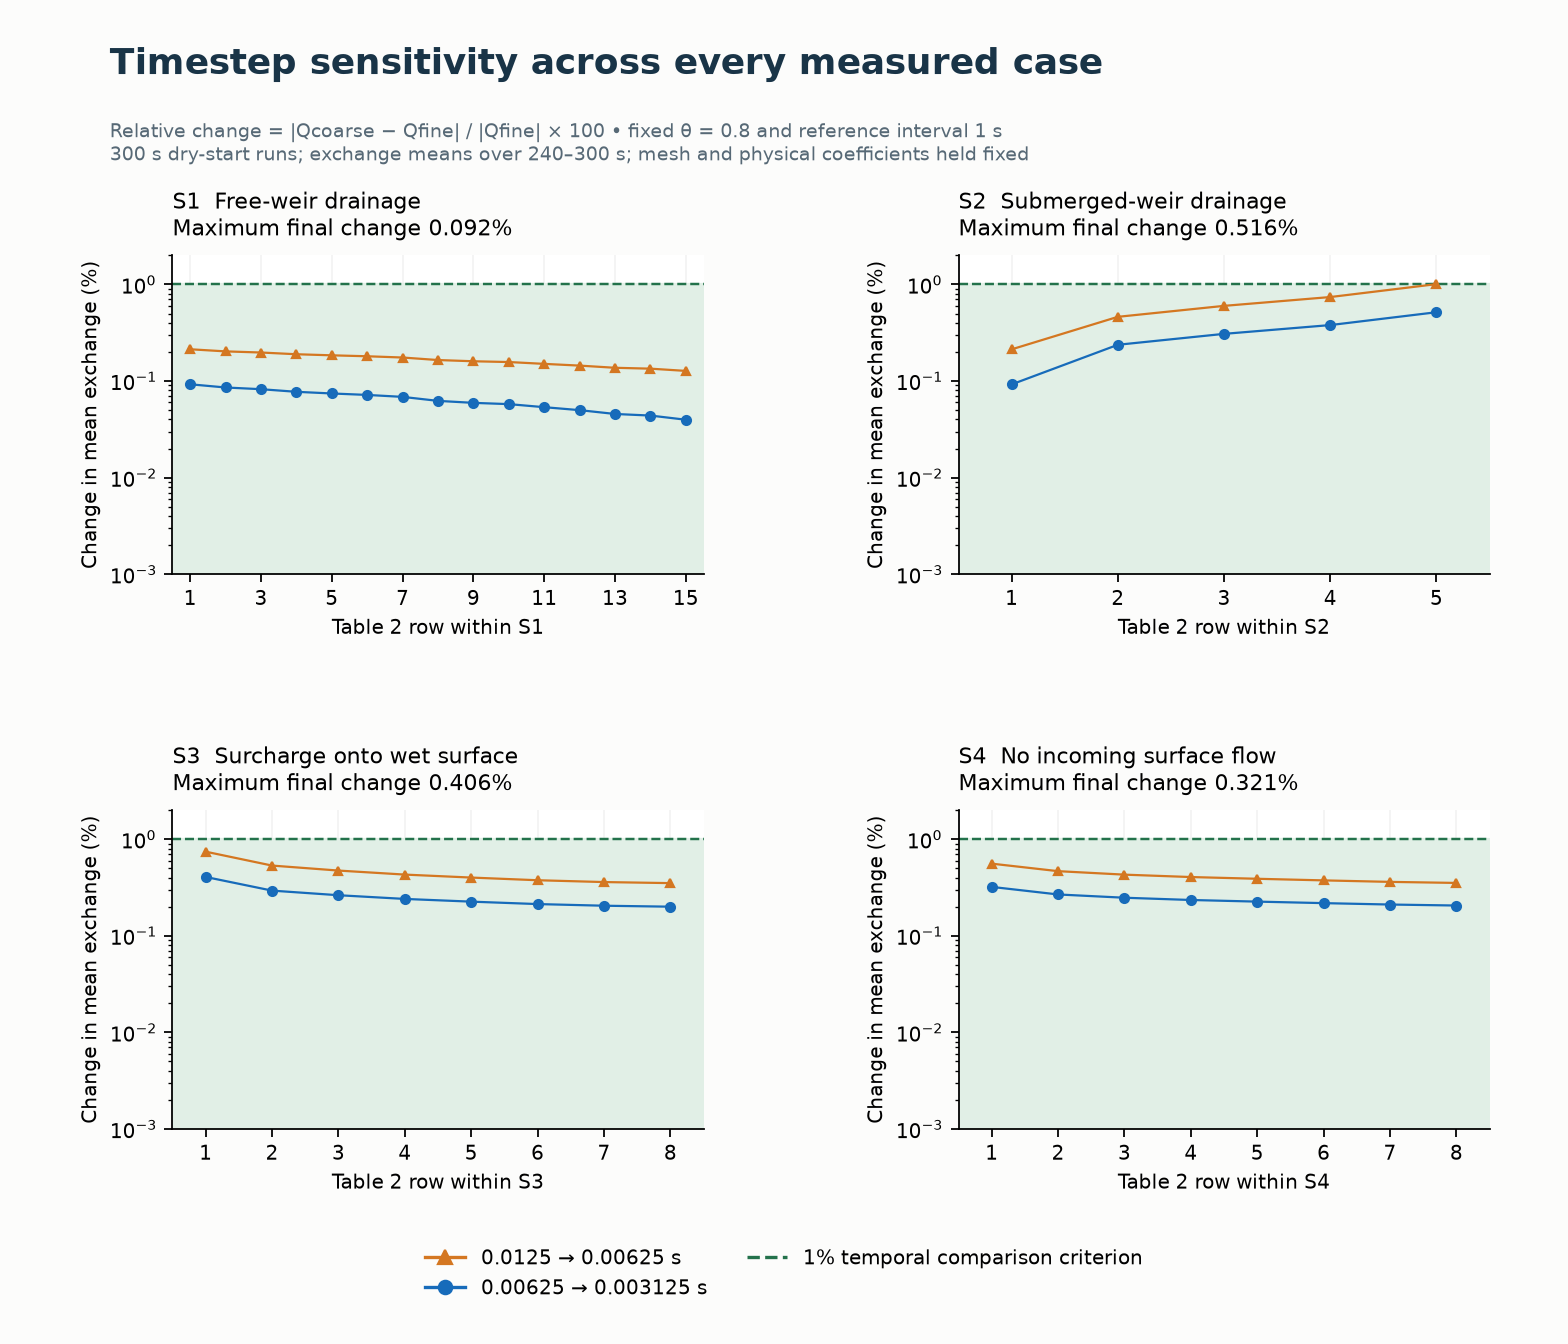
Orange triangles show 0.0125 → 0.00625 s and blue circles 0.00625 → 0.003125 s. Green shading is below the 1% comparison criterion; the ordinate is logarithmic. The single-cell delivery and spatial-convergence limitations remain.
Download the follow-up report and reusable figures, 36-case comparison table, and plotted data, heads and separate volume ledgers. The original transient viewer retains its original settings; no measured transient validation is added by this steady refinement study. Positive reference intervals require compatible engine support and surface GPU plugins at ABI 9.
CELL and STENCIL_WET_MEAN head sampling. Record the selected cell positions and heads; these options do not reproduce the paper's exact pressure transducer or complete circular-opening average.The measured transient sewer-head and exchange series have not been replayed. Table 1's ratios/durations do not determine those series. The synthetic demonstration cannot reproduce the paper's observed suction oscillation or establish transient experimental accuracy. The hydraulic reference insert and illustrated review state the regularisation, single-cell delivery and time-step limitations that require further work.
Reference: Rubinato et al. (2017), Journal of Hydrology 552, 421-432.
 1.9.8